Global Equities
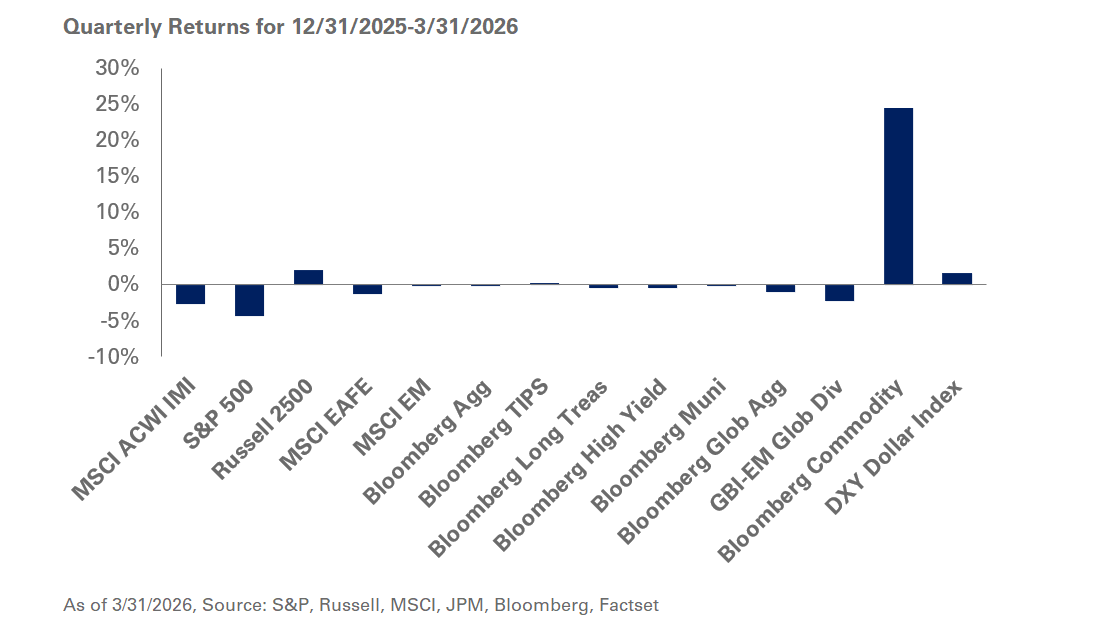
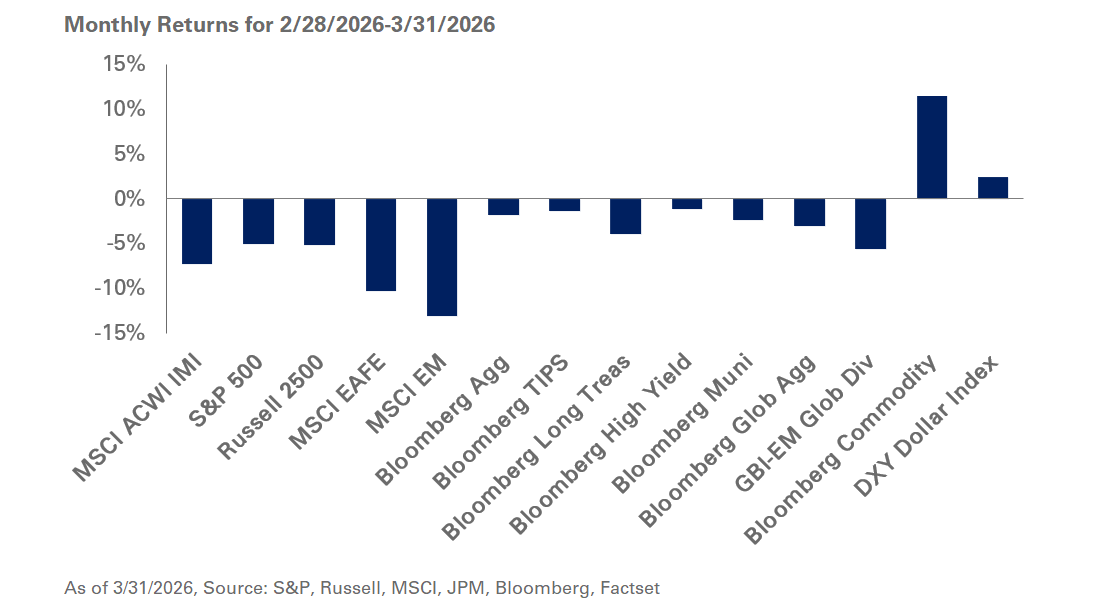
Equities were a mixed bag in the second quarter. The S&P 500 Index advanced a little over 4%, while the Russell 2000 and Dow lagged, closing out the quarter with losses of 3.3% and 1.3%, respectively. The relative strength of stocks in technology and artificial intelligence has fueled recent market strength. Nvidia, a stock that has accounted for one-third of the S&P 500’s total return in the first half of 2024, rose 37% in the three months ended June 30, and is up 150% for the year.
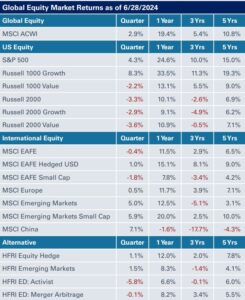
Outside the U.S., international equities also lagged. However, emerging markets and China were notable exceptions, with the MSCI EM Index up 5% and the MSCI China Index gaining 7.1%, for the second quarter. The MSCI EAFE ended the quarter down 0.4%, given its lack of exposure to the dominant tech and AI market space.
Meanwhile, fundraising activity in U.S. private equity totaled $155 billion in the six months ending June 30, while U.S. venture capital fundraising remained depressed at $37 billion, according to PitchBook. The total number of funds has remained below historical norms, underscoring a pullback from the asset class by overallocated investors and a flight-to-quality, as fewer firms raise a larger number of dollars, while emerging managers struggle.
New deal activity in U.S. private equity totaled $158 billion in the second quarter, down from $167 billion a year earlier, according to PitchBook. Exits in private equity-backed companies fell in the three months ended June 30, with exit volume totaling $64 billion compared to $79 billion a year ago. U.S. venture deal activity picked up in the second quarter, totaling $56 billion, its highest level since the second quarter of 2022, according to PitchBook. Exit activity for venture-backed companies totaled $24 billion in the three months ended June 30, up from a recent low of $6.9 billion in the third quarter of 2023.
U.S. private equity deal activity in the second quarter, at $158 billion, was down 6% from a year earlier, according to PitchBook. On the U.S. venture side, $56 billion of estimated value in the second quarter marked a 57% jump compared to a year earlier.
Global Fixed Income
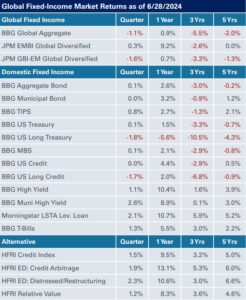
All eyes continue to be on the Federal Reserve as investors focus on the ‘if and when’ timing of monetary policy easing. Treasury yields remain volatile as market expectations shift: At the end of the second quarter, the market was pricing in two rate cuts by the end of the year, compared to at least five cuts in 2024 at the beginning of the year. The median fed funds rate projection has also gradually risen since the beginning of the year. Treasury yields steepened in the three months ended June 30. During this period, yields on the 30-year bond moved 20 basis points higher to 4.54%, compared to the two-year note, which ended the quarter 10 basis points higher at 4.72%—leaving the yield curve still modestly inverted.
Meanwhile, credit spreads finally ran out of steam with mixed results at the sector and sub-sector level in the second quarter. During this period, the spread on investment-grade corporate bonds widened four basis points but remained tight relative to historical levels; high-yield corporate bond spreads widened 10 basis points. Shorter- and intermediate-duration indexes eked out modest gains in the second quarter, while long maturity—10-to-30-year—investment-grade indexes were in the red; during this period, high-yield debt, bank loans and emerging markets were up in the 1%-to-2% range and the Bloomberg U.S. Aggregate Index edged higher.
Real Assets
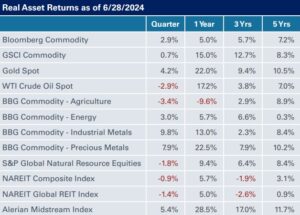
Following a strong first quarter, liquid real assets were mixed in the three months ended June 30. The Bloomberg Commodity Index was up 2.9% in the second quarter, though crude oil was down 2.9%, giving back a portion of its gains from the prior quarter. Midstream energy and gold were the strongest real asset performers for the quarter, with the Alerian Midstream Index up 5.4%, and the gold spot price posting returns of 4.2%
Global natural resources lost 1.8%, taking year-to-date returns to 0.4%. The S&P Global Infrastructure Index fared slightly better with gains of 2.7%. NEPC maintains a favorable view of both natural resources and infrastructure equities, but we continue to prefer private markets when it comes to implementing infrastructure in an investment portfolio.
While public real asset returns have been strong in the first half of 2024, real estate investment trusts remain the exception. The NAREIT Global REIT Composite Index was down 1.4%—its second-consecutive quarterly loss — while continuing its bumpy ride since the rate hikes in 2022.
Similarly, private real estate returns posted their seventh straight negative quarter, with the NCREIF ODCE posting a 0.45% preliminary gross loss for the quarter. The negative total return is inclusive of 1.47% asset depreciation, as the effects of rising interest rates continue to put pressure on asset values following historically high returns prior to 2022. Persistent challenges for traditional office continue to drag down returns across the board.
Real estate debt—despite its more conservative position in the capital stack—remains a bright spot as higher interest rates, impending loan maturities, and pullback from traditional lenders have led to higher return expectations that rival potential gains from value-add real estate equity. On the other end of the spectrum, opportunistic and distressed real estate investors may be able to capitalize on these factors to acquire high-quality assets suffering from capital structure issues. Managers of secondaries have also benefitted from this trend particularly as general partners seek creative solutions to recapitalize assets that have a limited buyer pool but retain value and upside. NEPC remains committed to a barbell approach to investing in closed-end real estate funds.
Private infrastructure strategies continue to garner increased interest among investors, and we are particularly constructive on tailwinds driving digital and communications infrastructure, renewable energy, and energy transition strategies.