The U.S. economy expanded at an annualized rate of 6.5% in the second quarter, falling short of the consensus estimate of 8.5%. Safe-haven assets ended July higher as concerns over the spread of the Delta variant and slower-than-expected growth weighed on investor sentiment.
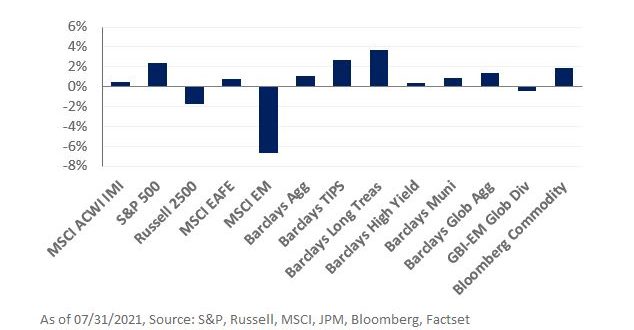
In equities, U.S. large-cap stocks outperformed with the S&P 500 Index gaining 2.4%. Growth stocks reestablished their dominance over value equities, outperforming for the second consecutive month, as long-term interest rates continued to decline; the Russell 1000 Growth Index increased 3.3%, while the Russell 1000 Value Index returned 0.8% in July. The MSCI Emerging Market Index underperformed, declining 6.7% last month. The MSCI China Index, which represents 35% of the index, fell 13.8%—the largest single-month decline since 2011—as concerns over regulatory risk in China weighed on mega-capitalization companies and the education sector.
Meanwhile, within fixed income, global yields moved lower. In the U.S., the Treasury yield curve continued to flatten with the 10- and 30-year yields falling 22 and 17 basis points, respectively. As a result, long-duration assets outperformed with the Bloomberg Long Treasury Index gaining 3.6% in July. The Fed Open Market Committee (FOMC) met at the end of the month and held rates near zero levels. However, it assumed a more hawkish tone suggesting that “the economy has made progress” towards its goals. Still, Eurodollar futures implied probability for a rate hike in 2022 declined significantly.
In real assets, the Bloomberg Commodity Index increased 1.8%. Spot gold prices rose 2.5% around concerns over slower-than-expected economic growth; the NAREIT Global REIT Index outperformed, up 4.2% in July.
Monetary and fiscal interventions continue to provide a supportive environment for equities. To that end, we encourage investors to favor equities relative to lower-quality corporate credit as spreads remain near cyclical lows. While interest rates have declined, we still recommend investors maintain a dedicated allocation to Treasuries to provide downside protection and support portfolio liquidity needs.