The latest fiscal year presented many challenges for colleges and universities as they navigated in-person learning in a COVID world and the possibility of lower enrollment. Yet, financial markets provided fair winds and following seas with higher educational endowments posting record returns.
Again, mega endowments led with many of the same themes we saw in recent years. Accommodative fiscal and monetary policies, coupled with the vaccine rollout and a reopening economy, provided a fertile environment for growth-oriented assets. The higher allocations of these mega endowments to private markets and their longstanding relationships with top-performing, capacity-constrained managers— often out of the reach of their less-endowed brethren—helped drive performance. While most endowments are united in their purpose of providing support to their institution in perpetuity, their resources and access to blue-chip managers vary widely by institution. In many cases, this is driven by size. The wealthier endowments, with an average value of $8.8 billion, have a significantly different profile, compared to the average fund size of $146 million in the Investment Metrics’ endowment and foundation universe (E/F universe).
Benefitting from their scale, mega endowments have tended to top their endowment/foundation peers on the performance league tables. This performance gap was immense in 2021 with the mega endowments outperforming the E/F universe by nearly 10 percentage points in the fiscal year ended June 30, 2021. Over this period, the median endowment returned 36.8% (net of fees) versus Investment Metrics’ 27.3% (net of fees).
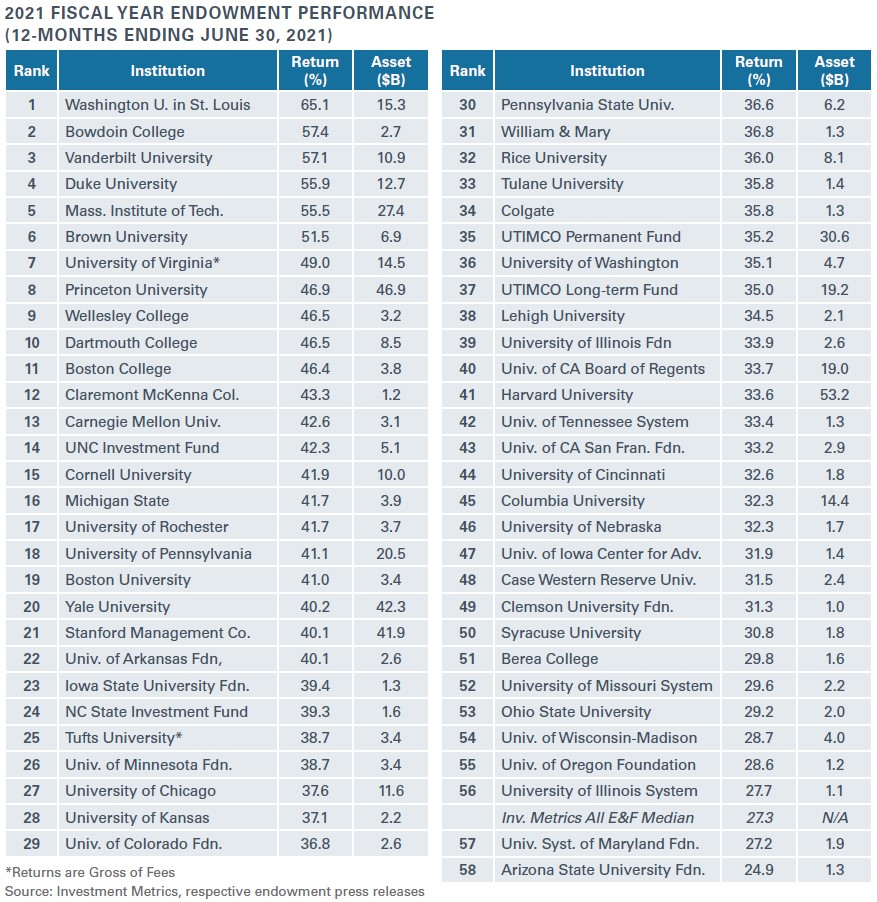
Washington University in St. Louis topped the list for this past year with an impressive 65.1% return. CIO Scott Wilson credits market beta with driving a large portion of the overall portfolio returns. He also highlighted the focus on emerging markets and co-investments alongside existing managers. Wilson shared that private markets, which account for around 40% of the portfolio, returned 82%, well ahead of the CA Global All PE Index’s 55%. The public equity portfolio’s returns were nearly as strong at 73%1, but were even more impressive on a relative basis, outperforming the MSCI ACWI by 33%. The investment office states a preference to partner with managers building concentrated portfolios with a greater ability to produce higher relative returns. Despite the success, Wilson is looking to remain disciplined and will focus on rebalancing the portfolio to maintain the risk profile. Notably, the university is putting the record-setting gains to work, announcing that it will no longer consider applicants’ ability to pay in the undergraduate admissions process.
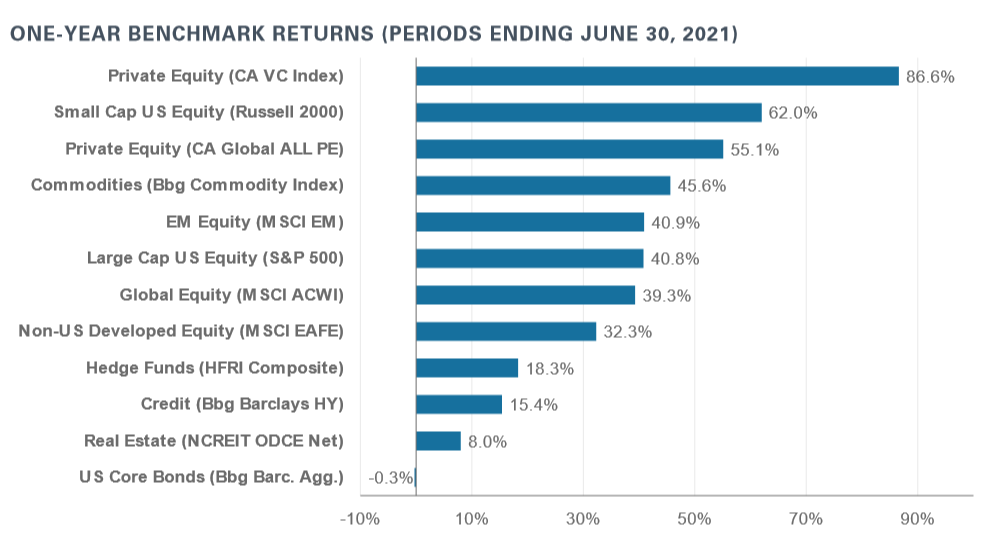
In recent years, we theorized that large endowments were generally outperforming their smaller peers due to higher allocations to private markets. For FY 2021, this remains the driving factor. At the start of this year, endowments with more than $1 billion in assets under management had a 10.8% allocation to venture capital and 13.6% to other private equity, significantly higher than the 3.0% and 6.7% allocations, respectively, for all endowments. These higher allocations coupled with the exceptional performance of private venture capital (+86.6%) and private equity (+55.1%) make it is easy to understand why the mega endowments sailed past their smaller peers in 2021. In addition, the mega endowments continue to benefit from mature private-market programs that are typically out of the J-Curve and their relationships with capacity-constrained managers.
At NEPC, we continue to assess the trends of the largest and top-performing funds. In the past fiscal year, higher allocations to private markets and access to top-tier managers have been major contributors of success for endowments2. While valuations are elevated, we believe that private markets will continue to provide an illiquidity premium relative to public markets and can play an important role in client portfolios. We recommend clients remain disciplined in their private market commitments and carefully consider manager and strategy implementation in the process. NEPC’s nearly 60-person strong research team works tirelessly to identify and gain access to the best managers. To learn more about how we can help you build and assess your portfolio, please contact your NEPC consultant.