Corporate defined benefit plans are thriving as they come off another year of robust returns from public equities, and elevated discount rates, according to NEPC’s annual Corporate Defined Benefit Peer Study and Survey.
With many plans now fully funded and liabilities representing a smaller portion of company market levels, many plan sponsors are opting to retain their plans and manage risk themselves. Despite the recent market volatility, we do not anticipate a meaningful deterioration in funded status levels as many plans remain well hedged. That said, we believe the current environment presents an opportunity to rebalance or potentially even de-risk further. Above all, we find that maintaining discipline around strategic asset allocation targets will be beneficial over the long term to plan sponsors.
The observations that follow are based on a review of filings from nearly 250 plan sponsors. Each year publicly traded companies are required to disclose information on their defined benefit plans as part of their annual 10-K reports filed with the Securities and Exchange Commission. The key measures disclosed in these filings include plan assets, liabilities, funded status, expected return on asset assumptions, discount rates, and plan allocations.
This year, we also surveyed corporate plan sponsors to get their views on key issues, ranging from future objectives for their plan, to their views on pension risk transfer; we received responses from 77 plan sponsors.
Data from our survey, combined with publicly available 10-K reports, provides a comprehensive snapshot of the health, trends and key themes dominating the universe of corporate defined benefit plans.
These are our primary findings:
1. Funded Status Levels Remain Healthy
The rush to de-risk and terminate may be slowing as funded status levels remain robust.
- Our peer study showed funded ratios have stabilized between 97%-101% over the past four years, up from 89% in 2020.
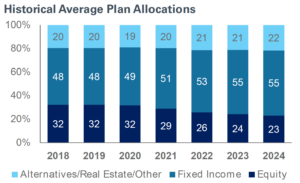
- Even though funded status levels remain elevated, we did not observe further de risking in 2024; the average fixed-income allocation rose to 55% in 2023, up from 49% in 2020, but plateaued last year with no change from 2023-2024 (see chart below).
- Similarly, the rush to terminate may have slowed as 58% of our survey respondents plan to retain their plan long term, with only 23% planning to fully terminate.
- Finally, only 4% of survey respondents are considering reopening their plan with another 6% exploring benefit modifications.
2. Majority of Plan Sponsors Are Opting to Retain Their Plan
Over half (58%) of survey respondents plan to retain their defined benefit plans for the long haul; those considering pension risk transfers (PRT) are conducting thorough due diligence when selecting insurers amid heightened legal scrutiny.
- Plan liabilities are shrinking, driven by rising discount rates and pension risk transfer activity. Among our 10-K peer group data, the median PBO-to-market cap was at 4.8% in 2024, down from 8.2% in 2018.
- Smaller overall liability profiles may be contributing to the delay in plan terminations. Even though 42% of survey respondents plan to terminate partially or fully, only 44% expect to do so within four years.
- 55% of the plan sponsors considering pension risk transfers are concerned about recent lawsuits, leading to higher scrutiny around the selection of an insurer.
- Most plan sponsors were unaware of private equity affiliations among certain carriers such as Athene, Global Atlantic, AIG, and Fortitude Re.
- About 73% of survey respondents plan to rely on their incumbent actuary for guidance around pension risk transfers, while 59% are considering an independent fiduciary or expert for added oversight.
3. Varying Approaches to Reducing Risk
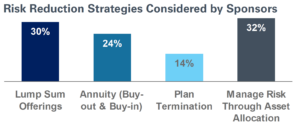
Elevated funded status levels are emboldening plan sponsors to take different approaches to reduce volatility:
- Plan sponsors surveyed are using a number of different tactics to manage risk including lump sum offerings (30%), partial pension risk transfers (38%), and strategic asset allocation decisions (32%).
- About 74% of respondents said their plans are on a glide path, but only 12% have reached their end-state portfolio.
- Our peer study showed public equity allocations continue to trend lower—down to 23% in 2024 compared to 32% in 2018—while allocations to alternatives/real estate are slightly increasing.
- Our survey results indicate that 15% of plan sponsors with private market allocations are maintaining commitments, with 8% exploring shorter-duration strategies like private credit.
4. Return Expectations Remain Steady
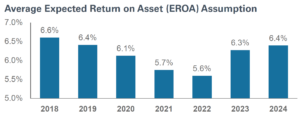
After a decade-long decline, the expected return on asset (EROA) assumptions moved higher in 2023 and then modestly rose again in 2024.
- Based on our 10-K peer group data, the average expected return on assets (EROA) increased to 6.4% in 2024, up 80 basis points since 2022.
- About 41% of plan sponsors raised their EROA assumption in 2024, while 35% held it constant
Higher expected returns may also be driving the decision for sponsors to retain their plan.
- Around 18% of survey respondents are retaining their plan to maintain pension income on the balance sheet, benefiting from high interest rates and favorable long-term expected returns.
5. Other Trends From Our 10-K Study and Survey Data
- The average discount rate reached 5.5% at the end of 2024, the highest level in at least a decade.
- Dispersion of funded status remains at the sector level, with financials (117% average funded ratio) and tech (109%); on average, materials (91%) and communication services (91%) had the worst funded ratios.
- Many plans are in a strong funded status position with approximately 70% of the universe ending the year with a funded ratio of 90% or higher; 10% of plans had a funded ratio worse than 80%.
- Plan sponsors have mixed views on the greatest threats to their programs: 26% of survey respondents cited inflation, 28% pointed to a slowdown in global growth, and 23% highlighted actions by the Federal Reserve as potential risks.
At NEPC, with funded status remaining elevated and volatility increasing, we recommend clients maintain or even increase interest rate hedge ratios to protect funded levels. Additionally, with the yield curve still relatively flat and liability durations shrinking, we suggest sponsors add exposure at the intermediate part of the yield curve. A thorough review of the plan’s credit exposures relative to liabilities may also be appropriate. Given the current market volatility, we also suggest taking advantage of market dislocations to rebalance.
We welcome the opportunity to discuss this subject in greater detail. We have provided a copy of our full survey results below. We can also provide a custom corporate pension peer report, which shows your plan’s metrics in relation to sector peers and our broader peer database. To learn more, please contact your NEPC consultant.