Factor investing can play an integral part in meeting your portfolio’s long-term investment objectives.
Over longer time horizons, investment factors have outperformed the market. However, in the short run, this approach can prove to be mercurial, and performance can be unreliable. An understanding of these factor exposures allows investors to tilt towards or away from specific sources of risk, empowering them to make more informed and judicious decisions. At NEPC, we believe that by building diversified multi-factor portfolios, investors can mitigate short-term downsides of specific factors, while still being able to harness their outperformance in the long run.
The primary aim of factor investing is to capture the premiums associated with specific risks in order to achieve long-term excess returns or a desired risk profile. Each factor can be considered a form of compensated risk, forming the foundational elements of a security’s return profile. For instance, similar to the equity risk premium that exists when investing in stocks, there is also a premium associated with investing in factors.
At NEPC, our portfolio construction team has extensive experience in crafting investment solutions to ensure the efficient allocation of capital. We believe applying deliberate factor exposures can bolster portfolio performance. However, since we recognize each factor introduces unique and specific risks, it is crucial to spread this risk across multiple different factors. It is also essential to customize specific factor exposures for each client which are aligned to their long-term goals and strategic mandate. To that end, we believe a balanced, multi-factor portfolio, comprising a varied set of factors, offers enhanced diversification, reduced risk, and increased returns over extended periods.
FACTOR INVESTING 101
An investment factor is any thematic security characteristic that can help an investor better understand and explain the long-term risk/return profile of a particular asset. Some of the most commonly used factors are called fundamental factors. In general, these can be broadly categorized as: value, size, momentum, low volatility, dividend yield and quality1.
Understanding how these factors influence portfolio performance enables investors to leverage potential benefits such as:
- Enhancing the risk/return profile of a portfolio
- Improving diversification
- Allowing investors to express specific views or preferences
- Aiding in excess return attribution
In factor investing, each factor has a straightforward concept. For instance, the idea behind value is that over the long term, investing in undervalued stocks tends to yield better returns than investing in more expensive ones. The same general framework applies to the other factors as well:
- Size: Smaller companies generally outperform larger ones.
- Momentum: Stocks that recently performed well are likely to continue outperforming.
- Low volatility: Securities with low volatility tend to outperform those with high volatility.
- Dividend yield: Stocks with higher-than-average dividend yields tend to outperform those with lower yields.
- Quality: Companies with strong balance sheets typically outperform those with weaker financials.
Andrew Berkin and Larry Swedroe expand on this idea of factor definitions in their book, Your Complete Guide to Factor-Based Investing: The Way Smart Money Invests Today. Berkin and Swedroe explain that factors are characterized by the conversion of a distinctive qualitative component into a quantitative expression. Recall, that the value factor is rooted in the belief that relatively inexpensive equities tend to outperform expensive ones. To quantify the qualitative aspect of ‘inexpensive’ and ‘expensive,’ investors use various valuation metrics, such as book-to market, cash flow and earnings.
However, this isn’t the only criteria for a factor to be considered an authentic factor. For a factor to be deemed “strong,” or one with genuine predictive power, it must meet consistent and stringent criteria. A strong factor should be persistent, pervasive, robust, investable and intuitive. If any of these criteria are not met, the factor in question may simply exist due to modelling errors or chance.
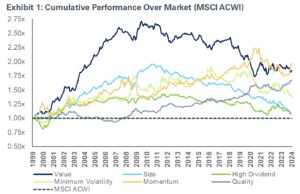
While these factors may differ in theme, what ties them together is their history of earning a long-term risk premium or return greater than the market (Exhibit 1).
These factors command a long-term premium because they represent systemic and undiversifiable components of risk, meaning they are inherent and unavoidable within the market itself. In other words, if systemic risk represents the ocean, then factors like value, size and momentum are currents within that ocean. As compensation for tilting towards and bearing this risk, investors have been rewarded with long-term outperformance.
1 Please note this list of factors is not exhaustive. While we have outlined some of the most popular factors here in this paper, there may be additional factors utilized by certain investors that are not listed here.
INVESTMENT FACTORS VS. STYLES
Additionally, when discussing how to define factors, it is also crucial to differentiate between investment factors from their proverbial cousins, investment styles. Investment styles, for instance, growth, value and core, are often used interchangeably alongside factors. However, there is a material difference between the two. 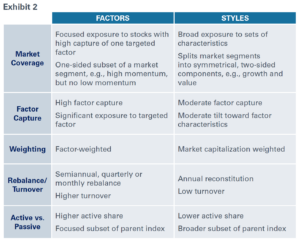
Investment factors refer to specific attributes that are analyzed individually, representing distinct dimensions of risk and return. Styles, on the other hand, are larger, broader classifications that encompass various strategies, often incorporating multiple individual factors themselves. FTSE Russell has put together an extremely helpful guide in delineating the differences between the two (Exhibit 2).
Overall, styles are useful for aligning portfolios with specific investment philosophies due to their wider categorizations. Conversely, factor analysis is helpful for identifying discrete variables influencing return, providing a more specific understanding of return sources, detailed performance measurement, and risk management.
HOW DID FACTOR INVESTING BEGIN?
The roots of factor investing extend back to at least the early 1930s. It was during this time that Benjamin Graham and David Dodd of Columbia University developed an investing method that targeted undervalued securities. Their thesis was simple: if the market value of an equity was lower than its intrinsic value, they would invest with the belief that the security’s market value would eventually catch up to its intrinsic value. Little did they know that this would be the beginning of value investing – a concept their protégé Warren Buffet subsequently furthered to immense success.
It was not until the early 1960s, when the work of William Sharpe, Jack Treynor, John Lintner and Jan Mossin led to the introduction of the Capital Asset Pricing Model (otherwise known as CAPM), that a formal framework for factor investing was put in place. It was the CAPM that stated the investment return of an asset could be explained by a single factor: market beta, that is, the security’s sensitivity to the broader market; any remaining return that was not explained by beta was labeled as idiosyncratic, that is, company-specific, or alpha.
Building upon the CAPM in 1976, economist Stephen Ross introduced the Arbitrage Pricing Theory (APT) which suggested a multi-factor (multi-beta) approach may be more accurate in explaining asset returns than the single-factor approach of CAPM. However, Ross did not specify what those factors should be.
It would not be until 1992, when Professors Eugene Fama and Kenneth French introduced the Fama-French Three-Factor Model which formally identified, named and incorporated the size and value factors into an asset pricing model. While it was widely adopted at the time, as it explained approximately 90% of an assets’ return, subsequent research has led to the inclusion of additional factors, leading to the current, and growing, factor repertoire we know today.
INVESTMENT FACTORS AT WORK
The primary aim of factor investing is to capture the premiums associated with specific risks to achieve long-term excess returns or a desired risk profile. In order to do that, factor investing combines elements from both passive and active management into its structure (Exhibit 3).
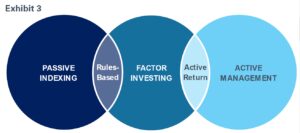
Similar to traditional index funds, factor investing is transparent and rule-based, designed to methodically identify companies with predefined factor-specific characteristics to produce systematic exposure at a low cost.
Conversely, factor indexes resemble active management in their selection of securities, use of non-market-cap-weighted methodologies, portfolio turnover, and pursuit of outperformance.
With this in mind, factors can be viewed as an active idea implemented passively, blending the potential benefits of both active and passive investing to pursue enhanced risk-adjusted returns.
FACTOR BEHAVIOR
To better gauge where factors may fit into a portfolio, some investors may wonder how this hybrid architecture translates to price patterns and performance behavior. Each factor represents its own unique dimension of risk, contributing to distinct patterns of return and volatility; categorizing factors into two groups—cyclical and defensive—simplifies this understanding.
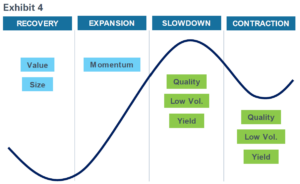
Cyclical factors, such as value, size and momentum, are more aggressive and typically riskier, exhibiting higher volatility relative to the market and other factors. They tend to outperform in up-markets but underperform in down.
In contrast, defensive factors like yield, quality and low volatility, aim to mitigate downside risk, resulting in a tempered risk profile. Defensive factors typically behave inversely to cyclical factors and outperform in down-markets but lag in up-markets.
The illustrative graph shown in Exhibit 4 helps define where in an economic cycle a factor has historically outperformed. Here we can see how the cyclical factors tend to find their stride in a risk-on environment, namely in a recovery and expansionary phase, whereas defensive factors typically perform best in a risk-off environment.
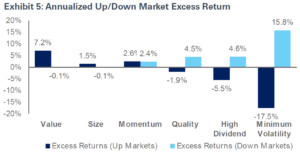
Additionally, Exhibit 5 more precisely quantifies this behavior between up-market and down-market excess returns generated by each factor, showing a clear difference in excess return production in opposing markets.
However, it is important to acknowledge that economic cycles, investor sentiment, and market conditions also influence factor behavior. Investors should not assume factors will behave identically as observed in the past. Factor performance and, consequently their behavior, tends to be oscillatory and somewhat unpredictable, specifically in the short term.
FACTOR PERFORMANCE AND CYCLICALITY
Factor cyclicality refers to the fluctuating performance of investment factors over time. While factor investing has shown a history of delivering excess returns over the long term, its short-term performance tends to be more variable, unpredictable and uncorrelated.
If we look back to Exhibit 1, we can observe several patterns over the last 25 years. Notably:
- The rise, and subsequent decline, of both size and value.
- The upward trajectory of quality and momentum, especially in the aftermath of the Great Financial Crisis.
- Several smaller, multi-year periods within each factor’s history where the factor declined noticeably against the market. For example, quality from 2003-2007, low volatility from 2009-2011, and momentum from 2021-2023.
To cast an even more critical eye on this cyclicality, the accompanying table in Exhibit 6 highlights key active drawdown statistics for each factor. From this, we see that:
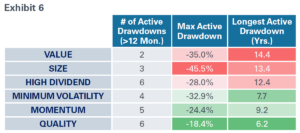
- Factors may underperform for extended periods regularly, as indicated by the number of drawdowns lasting over 12 months.
- Maximum drawdowns, especially for factors out of favor, can be significant, with value and size each showing drops of 35% or more.
- And lastly, the longest drawdown column emphasizes the enduring nature of these periods; for example, value, size and yield have experienced drawdowns lasting longer than a decade.
While the above statistics may seem worrying, this cyclicality is contractual to earning the long-term premium, as it represents the price for future excess returns. After all, factors are sources of risk, and adequate return cannot be generated without adequate risk. Therefore, periods of downward volatility, to some degree, should be expected.
Additionally, and perhaps more importantly, investors should remember that all factors, on average, have produced long-term excess return. While factor investing is by no means a get-rich-quick scheme, patient and disciplined investors tend to be rewarded.
Lastly, while cyclicality is a risk, it can also be utilized as an advantage. For instance, given that factors are typically both uncorrelated and have a long-term positive expected return, combining them into multi-factor portfolios should enhance the overall risk/return profile as opposed to relying on any one single factor in isolation.
COMBINING FACTORS
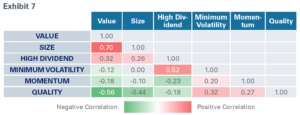
As we have discussed, factors have an independent return profile; meaning they each behave differently, especially over the short-to-medium term. This relationship is visualized in the excess return correlation matrix in Exhibit 7.
Lower correlations, highlighted in green, indicate a negative relationship, meaning when one factor does well, the other normally does not. Higher correlations, highlighted in red, indicate a positive relationship,
meaning both factors achieve under- and over-performance at the same time. By adding uncorrelated, or negatively correlated, assets to a portfolio, an investor is able to spread out risk and reduce the chance for significant losses. In short, when combining assets, or factors, with low correlations together, investors should be able to increase the level of diversification, ultimately strengthening risk-adjusted returns.
MSCI demonstrates this benefit quite effectively in its paper, Foundations of Factor Investing. In it, MSCI shows two graphs. The first (Exhibit 8) illustrates the individual risk/return profiles for each factor. This graph shows that although each factor has outperformed the benchmark, the dispersion of returns and risk varies by quite a bit.
The second graph (Exhibit 9) illustrates the impact of combining factors together. In the graph we see three hypothetical multi-factor portfolios: defensive, balanced and aggressive2. Here, we see that all portfolios clearly outperform the market index, as well as most of the individual factors. Additionally, these same portfolios achieve less dispersion and a more consistent risk level that is lower than (or approximate to) the market index. This graph shows that more efficient portfolios are possible by combining uncorrelated factors together into multi-factor allocations.
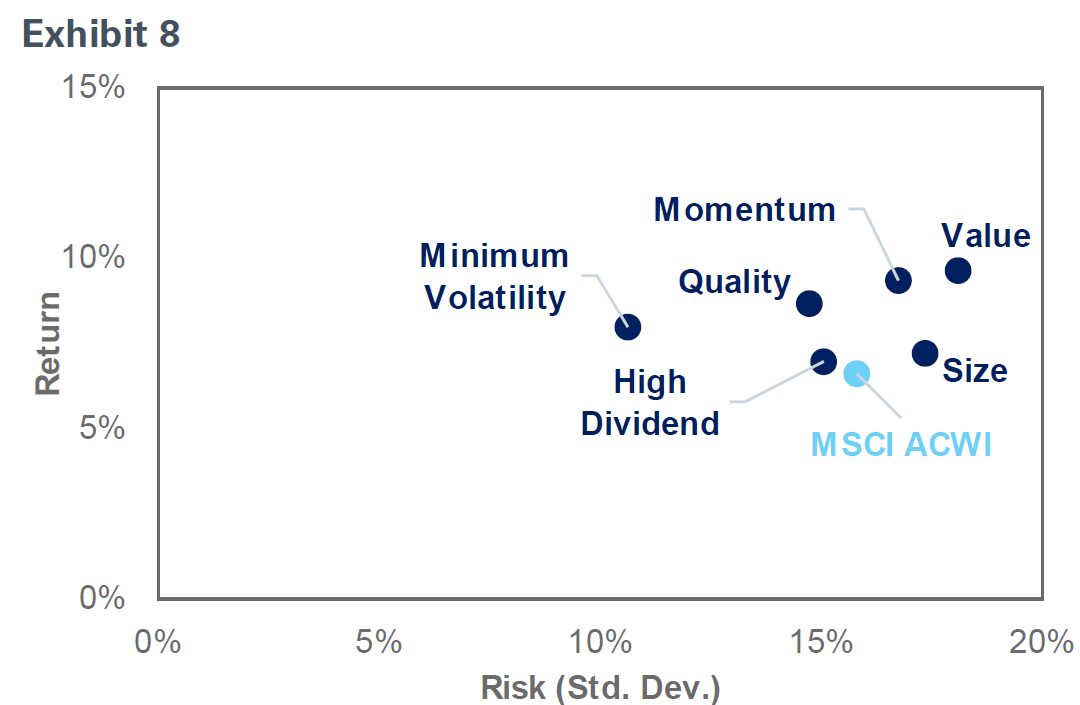
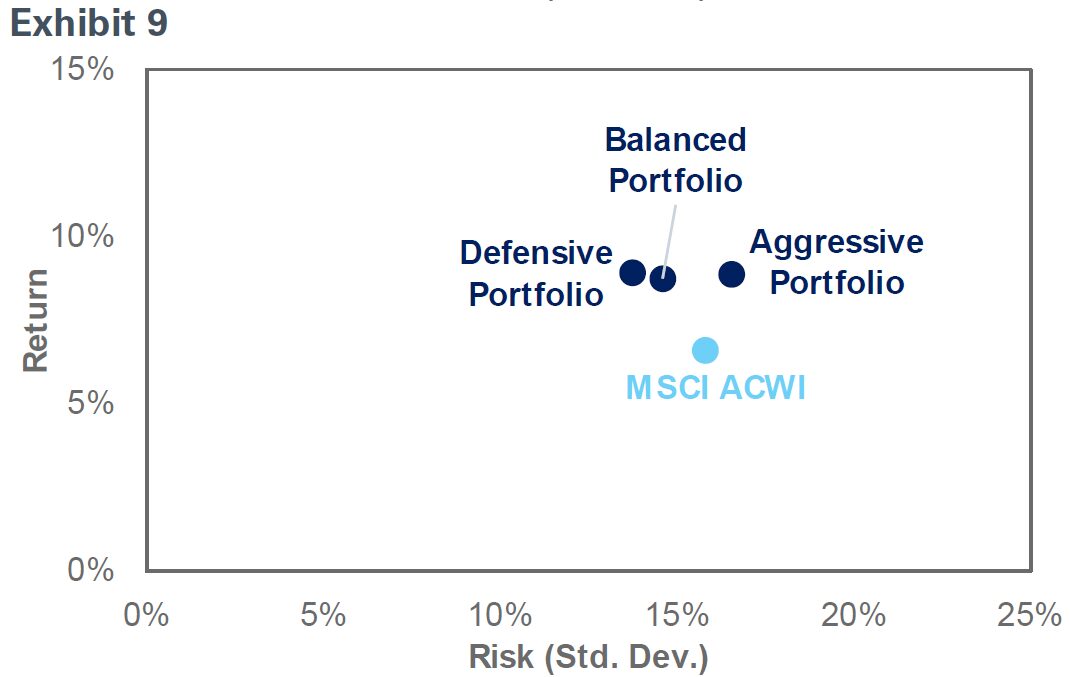
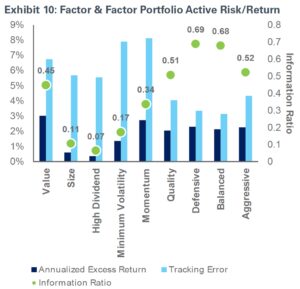
Exhibit 10 further crystalizes this idea by highlighting the relative profile of each of these factors and respective portfolios. The chart demonstrates that, in comparison to individual factors, a multi-factor portfolio, over the long term, exhibits lower tracking error, higher excess return and, consequently, a more favorable information ratio.
Another significant advantage of multi-factor portfolios is their resilience to market timing. Given the cyclicality of individual factors, it is evident that factors can underperform for prolonged periods. Thus, the question becomes: When is the right time to invest in factors? If investors tried to time the value or size trade, for example, at any point over the last decade, they almost surely would have lost money. However, the diversification advantages of multi-factor portfolios seem to significantly lower this risk of picking the wrong factor.
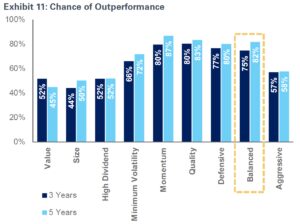
In Exhibit 11, the bar chart illustrates how often individual factors and factor portfolios outperformed the market covering both three- and five-year rolling windows over the last 25 years. It turns out, a diversified, balanced portfolio outperformed 75% and 82% of the time, respectively – this is well above the individual factor average of 62% and 65%, and nearly as effective as the best performing factor, momentum, which outperformed the market 80% and 87% of the time.
Collectively, these characteristics underscore the viability of multi-factor portfolios as effective instruments for enhanced risk-adjusted returns, irrespective of our position within the broader economic cycle.
2 Hypothetical factor portfolio allocations are structured as follows: Defensive: An equal allocation to defensive factors, including quality, low volatility and dividend yield. Balanced: An equal distribution across all factors, encompassing value, size, momentum, quality, low volatility and dividend yield. Aggressive: Equal weighting of cyclical factors, such as value, size and momentum.
NEPC PORTFOLIO CONSTRUCTION AND PHILOSOPHY
When it comes to factors and tangible portfolio application, the first and most critical step is knowing what you own. At NEPC, we utilize our proprietary portfolio analysis tool, C.H.I.L.L.3, to look into the portfolio to better understand the impact of the factor betas influencing returns.
For example, if a client’s portfolio heavily favors factors that are not in line with their objectives — such as if a risk-averse client’s portfolio tilts heavily towards aggressive, cyclical factors like momentum — it can expose them to unnecessary risks and yield suboptimal results. Recognizing this imbalance enables us at NEPC to take corrective action.
Moreover, based on the idea that adding uncorrelated, positive expected return sources to a portfolio is more capital efficient; at NEPC, we ideally like to see our clients maintain a balanced and diversified multi-factor allocation. The most common and practical path to achieve this is through a bottom-up approach, that is, through a client’s existing active managers. By gaining a clear understanding of the factor exposures within these managers, investors can simply adjust their risk profile by allocating more or less to specific managers. Additionally, gaining direct exposure to specific factors is increasingly feasible through factor indexes, commonly referred to as smart beta. While not universal, more firms now provide targeted factor indexes for clients to select from. These can be strategically used to adjust portfolios towards certain factors, either to address gaps or balance existing exposures.
Furthermore, a detailed understanding of a manager’s beta profile not only allows us to harmonize factor exposures, but also lets us hold our active managers accountable and ensure our clients are receiving excess return from sources beyond factors.
For example, one of the most important questions our research team needs to tackle is to figure out whether a manager is skilled and can produce alpha, or if they are just lucky and their past excess return is simply due to chance. Factor analysis enables investors to better discern this difference by breaking down the returns into alpha and beta (factor exposures).
For excess return to be considered alpha, it must be idiosyncratic, originating from stock selection or other sources unrelated to systemic risk. If a manager can consistently achieve this, it can be said that the manager has “skill.” Remember, the generation of alpha is the primary justification for high-fee active management as this return cannot be attained elsewhere.
So, if the entirety of excess return can be explained by beta, that may be considered “luck” and should raise concerns as this is not the purpose of active management. Take the example of a small-cap value manager: it is reasonable to expect that part of their outperformance comes from their focus on the size and value factors. Yet, if all their excess return can be attributed solely to these two factors (or others), it should spark scrutiny as factor beta can be obtain more cost-effectively through alternative means.
At NEPC, while we are not averse to paying higher fees for skilled, active management, it is crucial that our clients receive appropriate and commensurate alpha, and not just leveraged beta, as a reward for those fees.
3 C.H.I.L.L., or Centralized Home of Information for Liquid and Leveraged portfolios, is a portfolio analysis tool employed and designed NEPC Research. Its primary objective is to provide a comprehensive understanding of client portfolios, encompassing both quantitative metrics and qualitative insights. Please contact an NEPC consultant for more information.
CONCLUSION
We believe factor investing can be an integral component of your long-term investment strategy. Furthermore, we believe a multi-factor portfolio, comprising a varied range of factors, offers improved diversification, reduced risk and increased returns over an extended period, while mitigating the risks imposed by any one individual factor. Our portfolio construction uses an array of proprietary tools and analyses to implement a balanced and diversified asset allocation strategy to enhance the performance of your portfolio investments. To learn more about our process, please reach out to your NEPC consultant.
References
Bender, J., Briand, R., Melas, D., Subramanian, R. A., & MSCI Inc. (2013). Foundations of factor investing. In MSCI Index Research [Report]. https://www.msci.com/documents/1296102/1336482/Foundations_of_Factor_Investing.pdf
Berkin, A. L., & Swedroe, L. E. (2016). Your complete guide to Factor-Based Investing: The Way Smart Money Invests Today.
FTSE Russell. (2016). Styles vs. factors: what they are, how they’re similar/different and how they fit within portfolios. In www.FTSERussell.com (Figure 1. Distinguishing factors from styles (Pg. 2)).
ftserussell.com. (2019). Research Factor behavior through the cycle: Lessons from the Russell 1000 Index. https://www.lseg.com/content/dam/ftse-russell/en_us/documents/research/factor-behavior-through-the-cycle.pdf
Israel, R., & Ross, A. (2017). Measuring Factor exposures: uses and abuses. The Journal of Alternative Investments, 20(1), 10–25. https://doi.org/10.3905/jai.2017.20.1.010
Jennifer Bender, Remy Briand, Dimitris Melas, Raman Aylur Subramanian, & Madhu Subramanian. (2013). Deploying Multi-Factor Index Allocations in Institutional Portfolios. In https://www.msci.com. MSCI Index Research. https://www.msci.com/documents/1296102/1336482/Deploying_Multi_Factor_Index_Allocations_in_Institutional_Portfolios.pdf/857d431b-d289-47ac-a644-b2ed70cbfd59
Value Investing History | Columbia Business School. (n.d.). Columbia Business School. https://business.columbia.edu/heilbrunn/about/valueinvestinghistory